The recent naming ceremony of Facebook caught my eye, I noticed the symbolic play going on about the company but I seemed to be more intrigued by the new symbol of META. It looked different, peacefull, everending and capable of much much more. This reminded me of the paintings being made by the garage artists, hanging a paint bucket and pushing it on to a blank canvas. I was perplexed when I finally found an article for parametric curves and dwelled in to the beatifull mathematics behind art.
Art logos

Australian Broadcasting company
$$ A = 3, a = 1, B = 1, b = 3$$
Cisco Webex

MIT lincoln laboratory

Movies Anywhere

The university of Electro-Communications, Japan
Introduction
Curves are seen in a lot of applications from art, to engineering, to science. These curves also appear to be solutions to many solutions in the engineering field. It is well known that an arch which is a parabola which is a member of the family of conic sections. There are various ways to draw curves, we could draw using a parametric equation, a function could be written. At the same time we could use define the curve under different coordinate systems. It might be easier to draw a different curve on different systems.
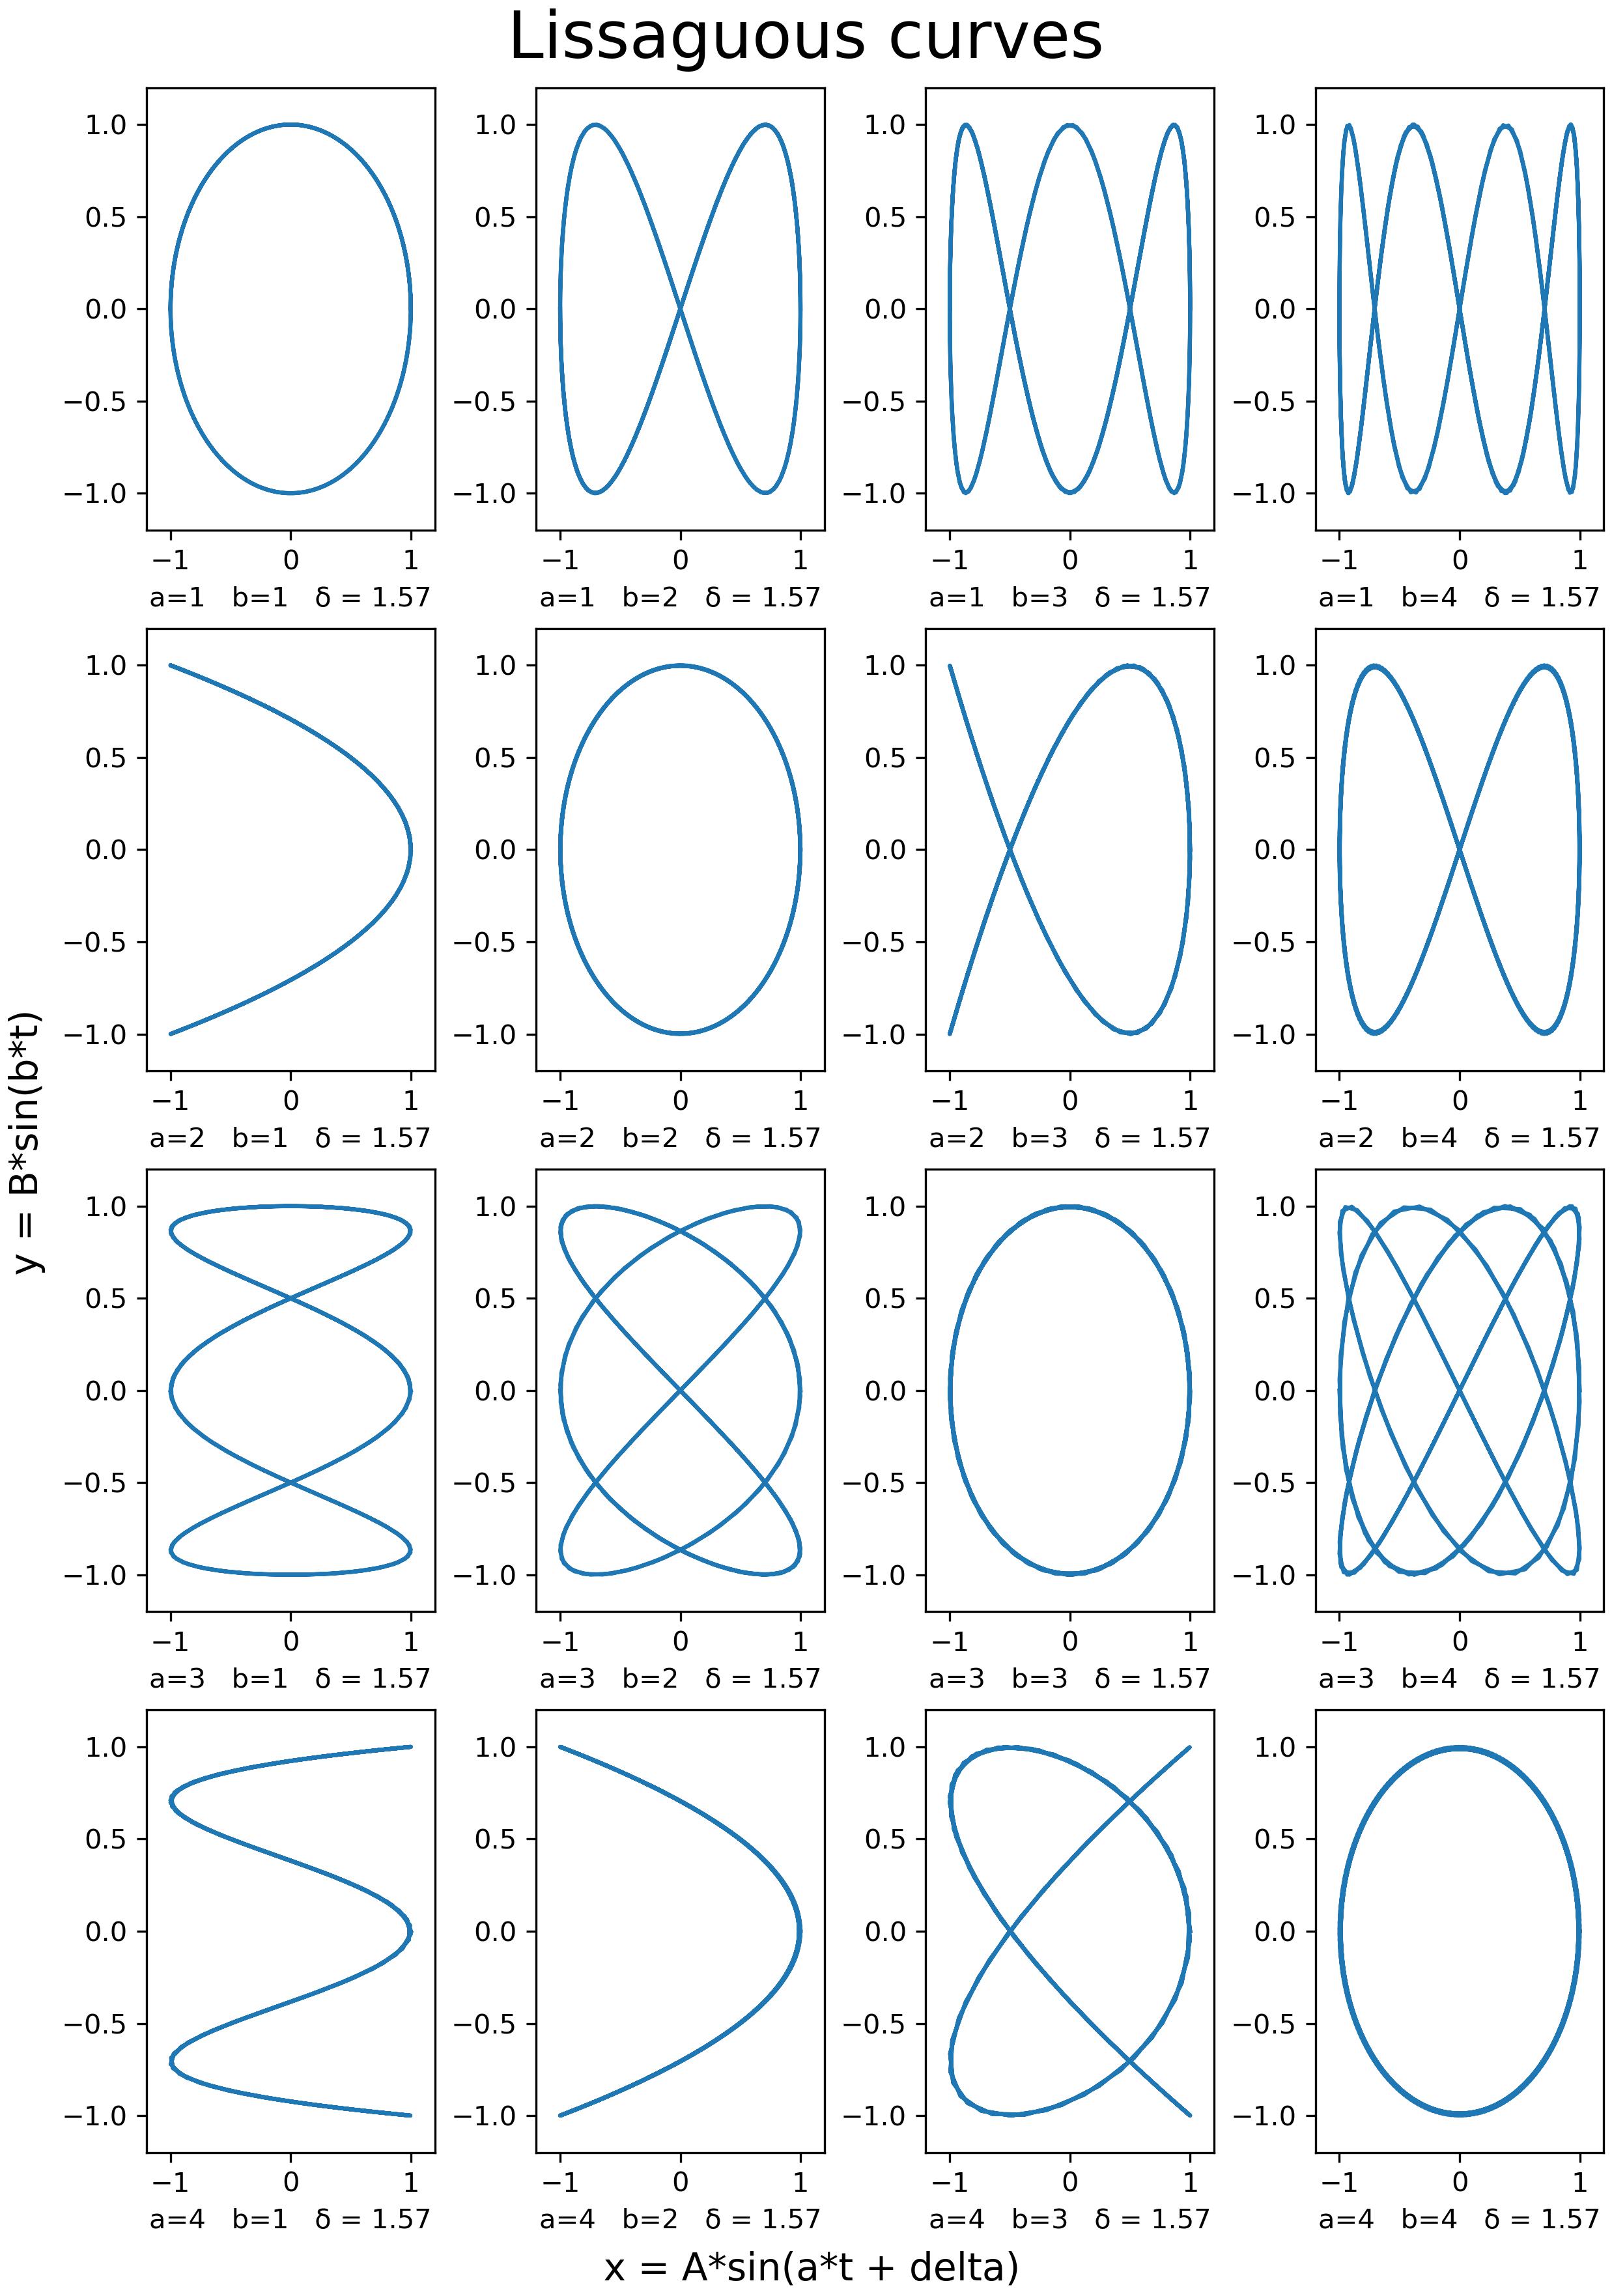
A lissaguous curve can be constructed with a parametric curve $(t)$ and 4 variables $( A, B, a, b, c, d )$
$$ \begin{array}{ccc|} x &= &A sin(at + \delta) \\ y &= &B sin(bt) \end{array} \quad 0 \leq\delta \leq \frac{\pi}{2} $$
Let’s have a look at what each of the variables would mean.
- $A$ : Amplitude in x direction.
- $B$ : Amplitude in y direction.
- The closer the two above values to each other the more the plot is square, as the values are further apart the plot is more rectangular.
- $a,b$ : Frequency in x,y direction respectively.
- This represents the frequency of the waves in x,y direction respectively. as the ratio increases the number of waves in the x,y direction respectively differ.
- $\delta$ : Phase difference.
- This explains the different starting locations of the respective starting locations of the x, y points.
- This would mean that we could move the curve around by varying the $\delta$ variable.
Lets plot for some of the variables mentioned above.
Visualisation
Now what are the best ways to visualise these equations. As you can see the equations are in the x, y axes its as simple as plotting them. But let us dwelve slightly more in to a different method.
Let us look at the video above, it appears that the curve is rotating anticlockwise. It seems clear that there is a repeatitive circular motion. At the same time from the figure above when both the frequencies $a,b$ are the same we notice a circle being formed. This circular repetetive motion of the curve against the screen then gives one of the plots & much like either a cylindrical co-ordinate system.
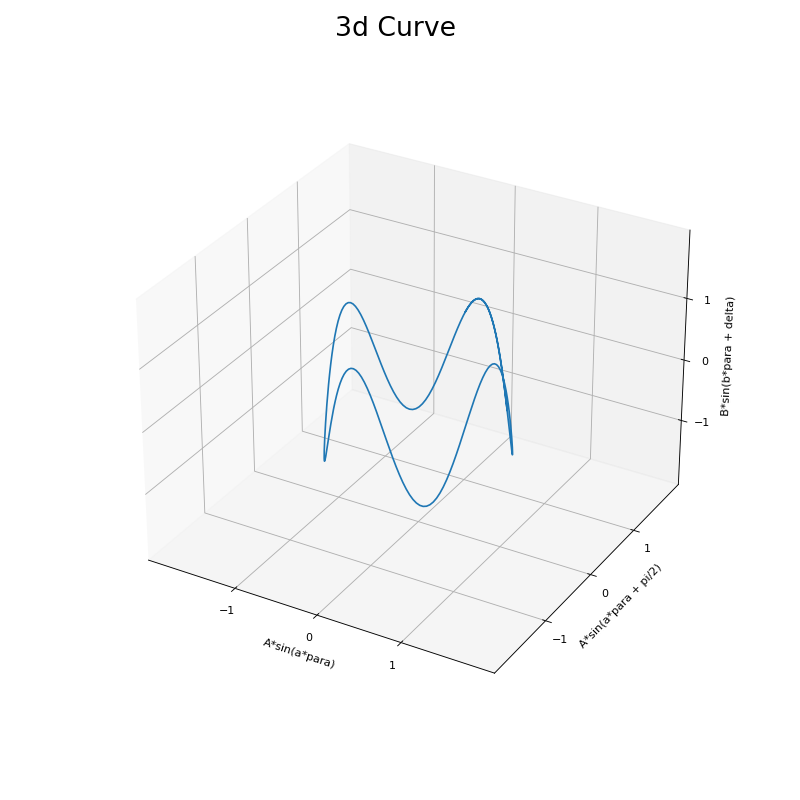
Let us make some modifications for the above equations to plot the system in 3 axes.
$$ \begin{array}{ccc} x &= &A sin(at ) \\ y &= &A sin(at + \frac{\pi}{2}) \\ z &= &B sin(bt + \delta) \end{array} $$
Now from the above parametric system of equations it is seen that x and y make a circle in the X/Y plane while the Z direction gives the magnitude in the z axis, thus forming a revolving and continuous curve along the circle. Plotting this diagram gives an appearance as below.
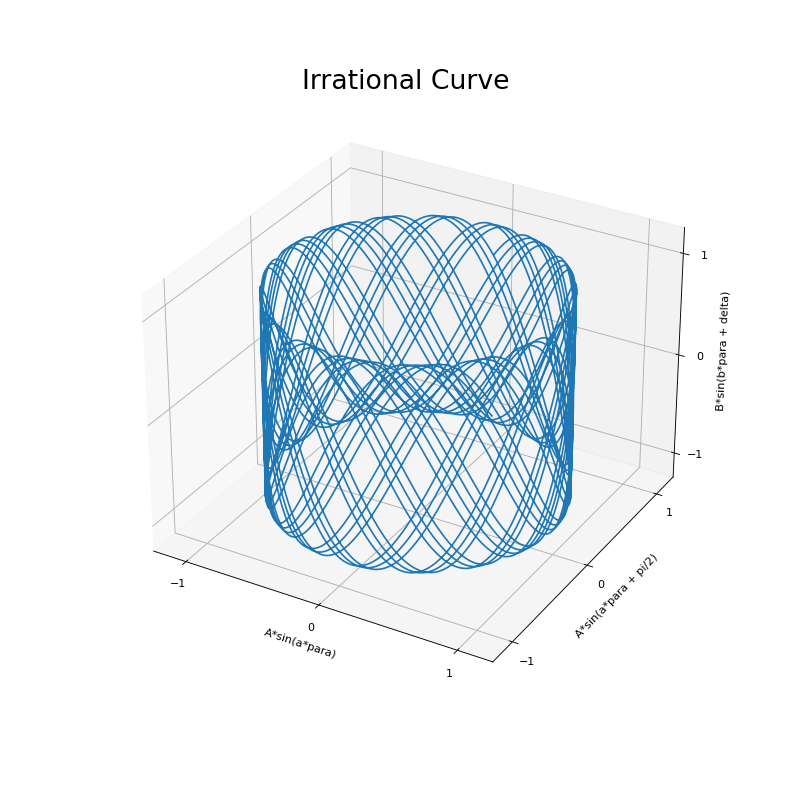
Now this has an eerily similarity to those of conic shapes such as parabola, hyperbolas, ellipses and circles. Much like the same one can construct lissaguous curves from such sections. Another interesting point to notice now is, such a plot has given rise to a continuous curve which repeats itself is it possible for the curve to never repeat? What would happen if we were to take slices of the above 3d cylinder at angles?
Interesting takes
Now that we can visualise the curves, let’s look at how they might vary with different values. Take a look at the variety of equations and understanding that the frequency is related to the variables $(a,b)$. At the same time the plot using the cylinder gives us the idea that the curve repeats itself, thus if there are irrational numbers for the values $(a,b)$, then the curve will never repeat.
As the terms $(a,b)$ represent the frequency at which the curve moves in the $(X-Y)$ plane and the sin curve on the $z$ axis. The ratio between the two terms are more important than the individual values respectively, this is represented clearly in Fig01.